Shopify blog


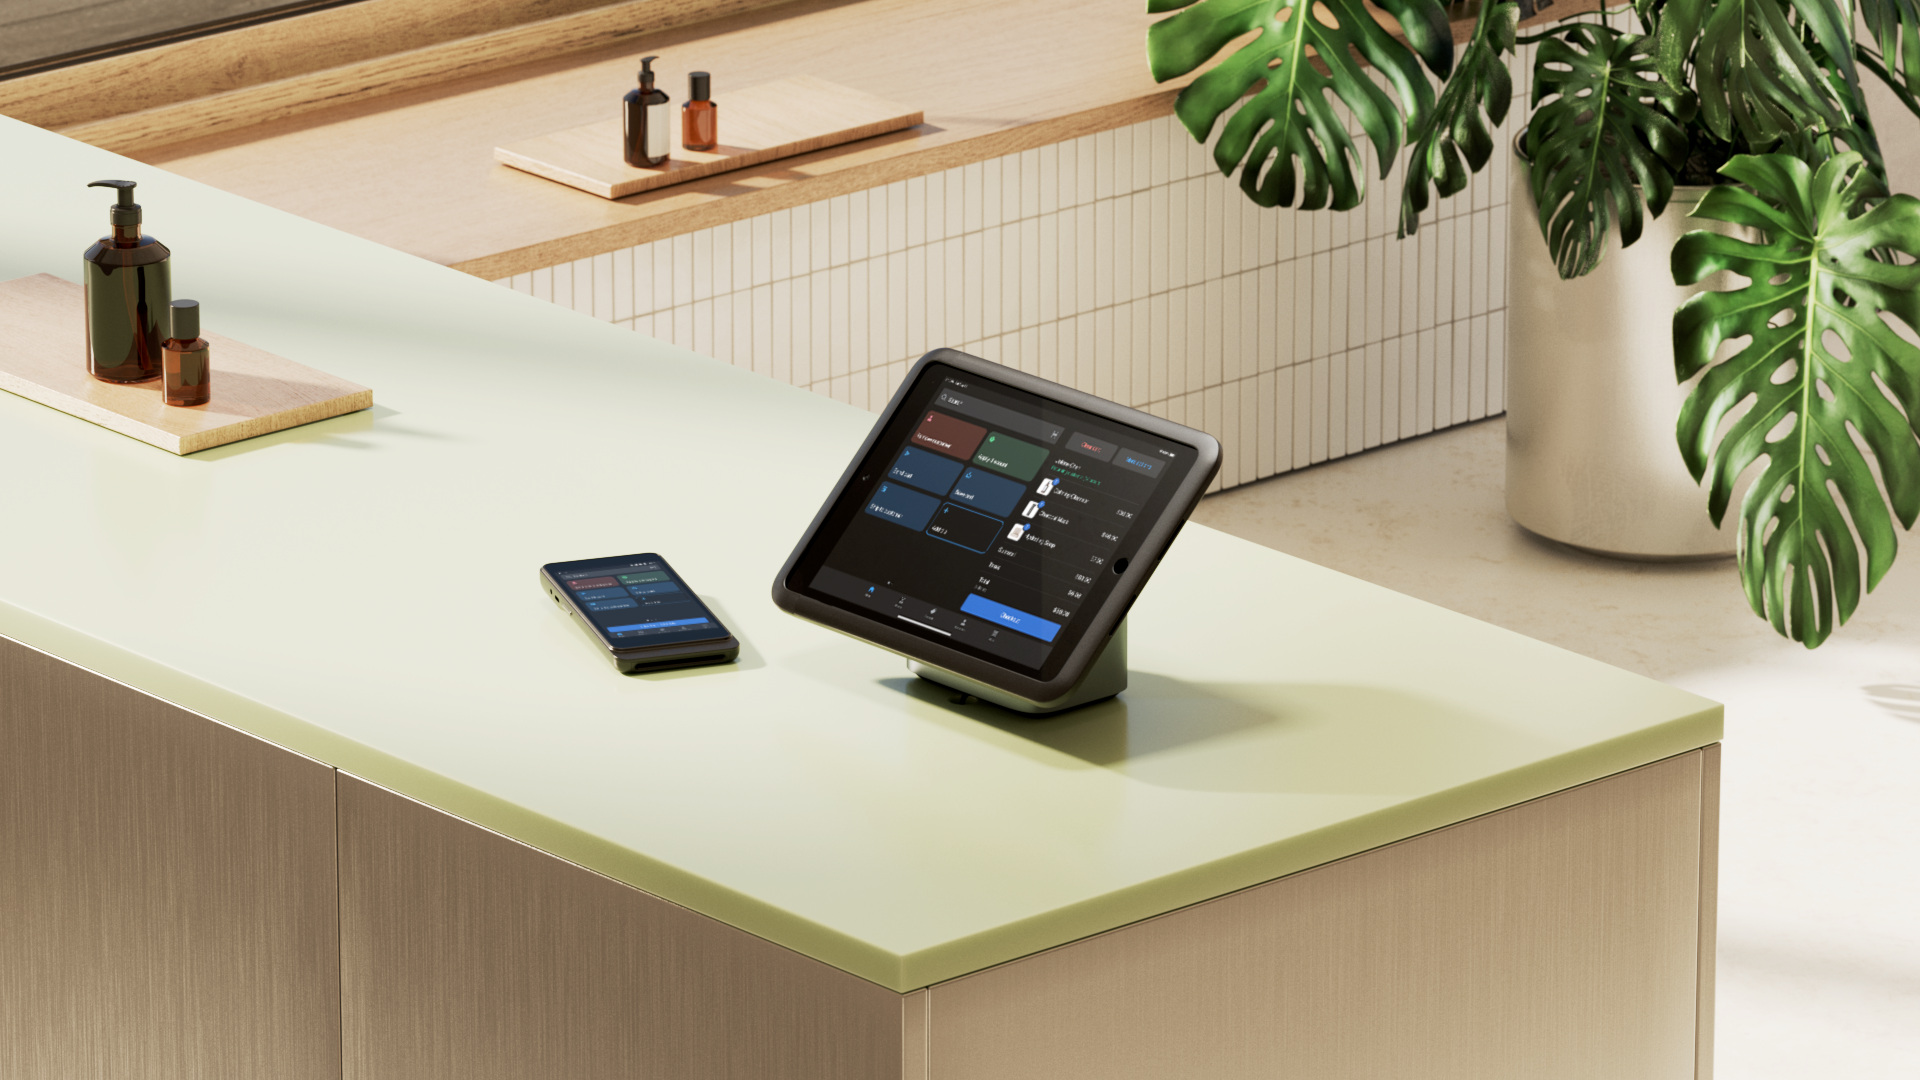
Retail operations today depend on a clear understanding of store performance across physical and digital channels. A well-designed store performance dashboard brings together the most important data: sales, inventory, staff performance, and customer behavior.
Unifying these data streams into a single view lets you spot trends faster, respond to issues proactively, and make confident decisions based on complete information rather than partial snapshots.
Ahead, you’ll learn the most important retail reports to pull and how to create a store performance dashboard.
What is a store performance dashboard?
A store performance dashboard is a visual reporting tool that tracks key metrics in one place. It helps store owners observe sales trends and make decisions about inventory buying, staffing, customer retention, and channel performance.
With a performance dashboard, stores can compare current results with earlier periods to identify changes in store performance. Shopify Analytics provides customizable dashboards and reports for this analysis.
Benefits of a store performance dashboard
Retailers use store performance dashboards to monitor results and guide operational decisions. The key benefits are:
- Faster decisions. In a 2025 Shopify survey, 65% of store owners said they waited for customer demand before scaling. A dashboard provides real-time visibility into changes in demand, with added context on cash flow, margins, inventory, and fulfillment capacity.
- Better inventory control. Combining sales and stock data can guide purchase orders. Deloitte found that one-third of retail executives planned significant investments in efficiency measures such as real-time inventory visibility.
- Store and staff visibility. Benchmarking results by location or employee eliminates operational blind spots. Visibility targets execution issues, addressing the concern raised in a 2026 Zipline survey where 43% of retail leaders admitted losing sales or revenue due to poor execution.
- Customer retention. Monitoring returning customer rates gives retailers early indicators of customer satisfaction. Since 47% of consumers report that poor service weakens their brand loyalty, dashboard alerts help managers fix service issues before they impact retention.
- Omnichannel reporting. Consolidating online and in-store data shows how each channel contributes to sales. Retailers can compare demand by channel and allocate inventory based on where customers are buying.
Essential reports for your retail store performance dashboard
Gain more insights from your retail analytics with these reports:
POS reports
POS reports break down in-store sales by product, location, and staff member. Retailers can use these results when reviewing schedules, training, or sales analytics.
Here are some reports to pull:
- Retail sales by product. Shows the breakdown of total sales of your products at a POS location.
- Retail sales by product variant SKU. Provides sales data based on specific product variants.
- Retail sales by product vendor. Displays sales information categorized by product vendor.
- Retail sales by product type. Offers insights into sales based on the type of product sold.
- Retail sales by point of sale location. Shows sales data for each POS location.
- Retail sales by staff at register. Provides sales data attributed to staff members at the register.
- POS total sales by staff member. Shows sales credited to each staff member, including line items they assisted with even when another employee processed the transaction.
- Custom sale items in reports. Shows reporting for custom sale items entered at the register. Retailers can use this report to review ad hoc sales, track non-catalog items, and identify where custom items are being used most often.
Inventory reports
Inventory reports show how quickly products sell and how long current stock may last. A low days-remaining figure can trigger a reorder.
Some important inventory reports to look at are:
- Month-end inventory snapshot. Displays the quantity of each product variant in stock at the end of each month.
- Month-end inventory value. Shows the total value of your inventory at the end of each month.
- Average inventory sold per day. Provides the average number of units sold per day for each product variant.
- Percent of inventory sold. Indicates the percentage of inventory sold during a specific period.
- ABC analysis by product. Categorizes products into A, B, or C grades based on their contribution to sales revenue.
- Product sell-through rate. Shows the percentage of total inventory sold during a selected time frame.
- Days of inventory remaining. Estimates the number of days your current inventory is expected to last based on sales rate.
Sales reports
Sales reports track where revenue comes from and how results change over time. For example, sales by channel can reveal whether online or in-store revenue is growing faster.
A 2025 Shopify survey found that store owners with more than $1 million in revenue tracked a wider range of metrics. These merchants were more likely to monitor revenue, profit margin, cash flow, average order value, growth rate, return on ad spend, conversion rate, and Net Promoter Score.
Some top sales reports to review are:
- Sales over time. Displays the number of orders and total sales over a selected period.
- Sales by discount. Shows sales data related to discounts applied.
- Sales by traffic referrer. Provides insights into sales based on the source of traffic.
- Sales by billing location. Displays sales data based on the customer's billing location.
- Sales by checkout currency. Shows the breakdown of sales by the currency used at checkout.
- Sales by channel. Provides sales data for each of your active sales channels.
- Sales by customer name. Displays the breakdown of orders by customer over a period of time.
- Average order value over time. Shows the average value of orders over a selected period.
Customer reports
Customer reports track first-time and returning customers, cohort behavior, predicted spend, and RFM segments. Retailers can use these reports to identify loyal customers or groups at risk of leaving.
By unifying customer data from your POS systems, ecommerce platform, and customer loyalty programs into a single view, you can understand the true customer journey and lifetime value. Plus, you can provide personalized customer experiences that build stronger relationships.
Here are the essential reports to monitor in your dashboard:
- Customers over time. Displays how many customers placed orders with your store over a selected period
- First-time vs. returning customer sales. Shows the value of orders placed by first-time and returning customers
- Customers by location. Provides data on new customers organized by geographical location
- Returning customers. Displays data about customers whose order history includes two or more orders.
- One-time customers. Shows information about customers who have placed only one order.
- Customer cohort analysis. Analyzes groups of customers based on their first purchase date and their repeat purchase behavior.
- Predicted spend tier. Categorizes customers based on their predicted spending behavior.
- At-risk customers. Identifies customers who are less likely to return to make another purchase.
- Loyal customers. Highlights customers who have shown loyalty by making multiple purchases.
- RFM customer analysis. Segments customers based on recency, frequency, and monetary value.
Store performance dashboard examples
Dashboard design depends on the size and structure of the retail business. One combined view may be enough for a small store. However, multilocation retailers may benefit from dedicated dashboards for inventory, sales, staffing, and customer retention.
This table shows a variety of dashboard examples and what they track:
| Dashboard example | What it tracks | How to use it |
|---|---|---|
| Sales performance dashboard | Revenue, AOV, discounts, referrers, channels | Find revenue drivers |
| Inventory dashboard | Sell-through, days remaining, ABC grade, stockouts, value | Guide inventory decisions |
| POS/location dashboard | Product, location, staff, type, vendor | Compare store performance |
| Customer dashboard | Repeat purchases, cohorts, spend tier, at-risk customers, RFM | Find retention opportunities |
| Retail KPI dashboard | Revenue, margin, cash flow, conversion, ROAS, CAC, NPS | Review overall performance |
Kenny Flowers uses custom reporting to compare its Charleston store with the brand’s other sales channels.
“We created custom reports that show us exactly how our Charleston store is performing compared to our other sales channels,” says Kenny Haisfield, founder of Kenny Flowers. “This visibility helps us monitor sweet spots in store traffic, determine optimal staffing levels, and make data-driven decisions about everything from inventory to store hours.” The number of retail metrics monitored usually grows with the business. A 2025 Shopify survey found that 30% of store owners earning more than $1 million tracked customer acquisition cost. Among store owners earning less than $100,000, that figure was 5%.
This sixfold difference illustrates how reporting priorities vary by business size. Newer merchants may focus on sales and inventory. Higher-revenue merchants may also track acquisition costs, profitability, and customer retention.
How to create a store performance dashboard
Follow these steps to build a dashboard that supports specific retail decisions:
- Define the goal. Start with the decision the dashboard needs to support. For example, a retailer trying to reduce stockouts needs an inventory-focused view.
- Choose the KPIs. Select a small group of metrics that measure progress toward the goal. For instance, sell-through rate and days of inventory remaining can inform replenishment decisions.
- Connect the data. Confirm that each sales channel sends accurate data to the same reporting system. Shopify Analytics can combine activity from Shopify POS and the online store.
- Build the views. Use Shopify’s metrics library to add and arrange dashboard cards. For deeper analysis, create a custom data exploration or write a ShopifyQL query.
- Set a review cadence. Check operating metrics each day. Review longer-term trends on a fixed weekly or monthly schedule.
- Act on the results. Assign an owner and response to each important metric. If inventory falls below a set threshold, the buyer can place a reorder.
Shopify lets merchants save custom data explorations on any subscription. Available reports still vary by plan, but the Advanced plan offers the most comprehensive reporting and predicted values.
Store performance dashboard FAQ
What metrics should a store performance dashboard track?
Begin with revenue and profit margin to measure financial performance. Add sell-through rate for inventory and returning customer rate for retention. Multilocation retailers can also compare sales by store or staff member.
How do you measure retail store performance?
Set targets for the metrics linked to each store’s goals. Compare actual results with those targets and previous periods to measure progress.
How do you create a store performance dashboard?
Start by identifying the metrics that matter most for your specific business goals and make sure you have reliable ways to track them consistently. Then choose a platform that can pull all this data together seamlessly, like Shopify, and present it in a way that makes it easy to spot trends and take action.
What are the best retail dashboard examples?
The best retail dashboard examples vary by use case. A sales dashboard is best for tracking revenue trends, and an inventory dashboard is best for making replenishment decisions. Some retailers may also need separate views for store and customer performance.
How do you use a store dashboard for store performance analysis?
Use the dashboard to spot changes in key metrics. Open the related report to diagnose the cause, take action, and review the result during the next reporting period.